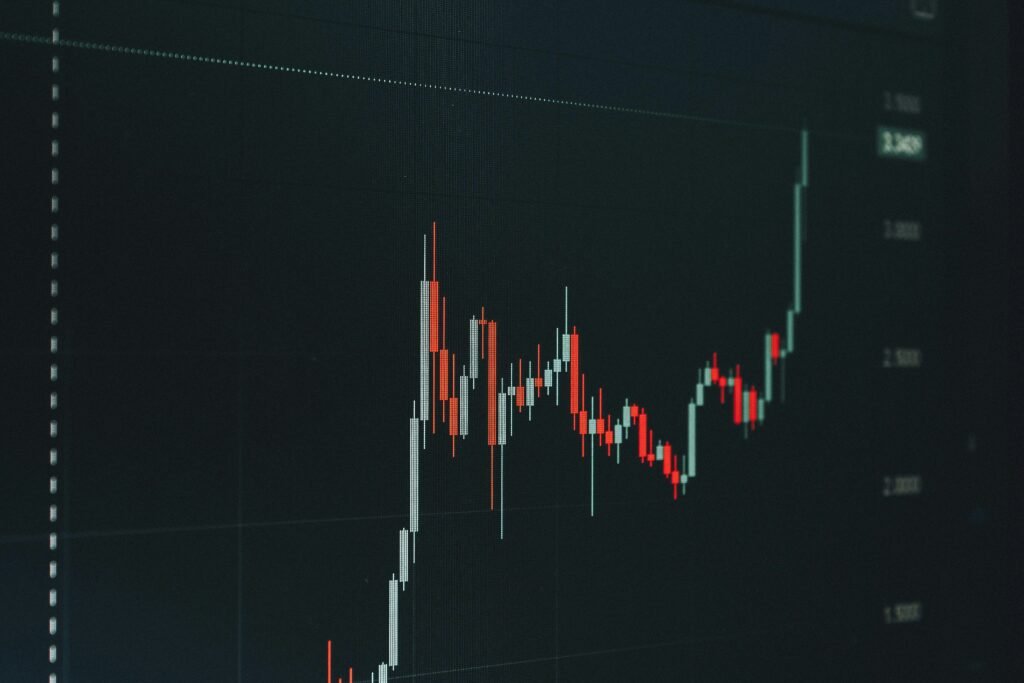
The first 30 minutes after the cash open can make an NQ chart look easy right up until it wipes out a trader who chased the first candle. That is why a real opening range breakout example needs more than a line above the high and a line below the low. You need rules for the range, the trigger, the stop, the target, and the trade you refuse to take.
For futures traders, the opening range breakout, or ORB, is a structure play. It gives you defined prices at the busiest part of the session, when NQ and ES often deliver their largest moves and their most expensive traps. Drop the nonsense and noise. Your job is not to predict every tick. Your job is to recognize when price accepts outside a defined range and manage risk without improvising.
What an Opening Range Breakout Actually Measures
The opening range is the high and low created during a specific window after the US cash market opens at 9:30 a.m. Eastern Time. Many traders use the first 5, 15, or 30 minutes. There is no magic timeframe. A 5-minute range produces more signals and more fakeouts. A 30-minute range filters some noise but can leave less room before the first major move is finished.
For NQ scalpers, a 15-minute opening range is often a practical middle ground. It captures the initial order flow without forcing you to wait through the entire first half-hour. For ES, which typically moves more slowly than NQ, a 30-minute range can make sense when you want fewer, cleaner decisions.
The key is consistency. If you use a 15-minute range today, do not switch to five minutes tomorrow because you missed the first move. That is not adapting. That is chasing.
Opening Range Breakout Example: NQ Long Setup
Assume it is a normal trading day and you trade the Nasdaq E-mini futures contract. Between 9:30 and 9:45 a.m. ET, NQ establishes an opening range with a high of 18,250 and a low of 18,180. Your range is 70 points wide.
At 9:47, price pushes above 18,250. A weak approach would be buying the instant price ticks one point above the level. That is how traders get pulled into opening volatility with no confirmation. Instead, use a rule-based trigger.
One clean trigger is a 1-minute candle close above the opening-range high, followed by a retest that holds above that level. In this example, NQ closes at 18,258, pulls back to 18,252, and then buyers step back in. If your entry rule requires the reclaim and hold, your long entry may be 18,260 once price breaks the retest candle high.
Your stop belongs where the trade idea is invalidated, not at a random dollar amount that feels comfortable. If price falls back through the breakout level and loses the retest low, the breakout has failed. In this case, a stop at 18,244 places 16 points of risk on the trade.
Now define the profit plan before you enter. A common first objective is 1R, meaning one unit of risk. With 16 points at risk, the first target is 18,276. A second target could be 2R at 18,292, or it could be a nearby intraday resistance level if that level comes first.
If the first target hits, you can take partial profit and move the stop on the remaining position according to your plan. Some traders move to breakeven. Others keep the original stop until a new higher low forms. It depends on your testing and the session’s volatility. What does not work is moving the stop emotionally every time a candle flickers red.
Why the Long Setup Has Context
A breakout level by itself is not enough. In this opening range breakout example, the long has better odds when it aligns with the broader session context. Maybe NQ held above the prior day’s close, overnight buyers defended a support zone, and the opening range formed near the top of the early auction rather than in the middle of a choppy mess.
You do not need ten indicators to see this. Price location, opening-range structure, and momentum at the breakout tell you plenty. When you pile on oscillators, moving averages, and social-media opinions, you usually create three reasons to enter and three reasons to hesitate. That is not analysis. It is decision paralysis.
The Same Setup Can Fail Fast
Now change the sequence. NQ breaks above 18,250, prints 18,258, and immediately snaps back below the range. The next candle closes at 18,242. That is not a reason to widen your stop and hope. It is evidence that buyers did not hold the auction above the opening-range high.
A failed long breakout can become a short setup, but only if your rules allow it. Price should show acceptance back inside the range or break below a meaningful short-term low. Do not automatically reverse because one trade lost. Reversal trading without confirmation is just revenge trading wearing a different shirt.
This is where prop firm traders need to stay sharp. One controlled loss is business. Two or three oversized attempts to recover it can destroy a daily loss limit before the real move even begins. Tight rules protect the account and protect your ability to trade tomorrow.
A Simple ORB Rule Set for ES and NQ
Your opening range breakout system should be simple enough to execute while the market is moving fast. Start by defining the opening range at the same time every day. Mark the high, low, and midpoint. Then decide whether you only trade a break and retest, or whether a strong candle close beyond the range is enough for entry.
For a long, require price to break above the range high, demonstrate acceptance above it, and provide an entry that still allows a logical stop. For a short, reverse the conditions below the range low. If the stop required by the structure is too large for your account or prop firm rule set, skip it. A setup is not mandatory just because it appears on the chart.
Target selection should also be objective. Traders commonly use fixed R multiples, prior-session highs and lows, overnight levels, or measured moves based on the width of the opening range. A 70-point NQ range can project a 70-point move from the breakout level, but that projection is a reference, not a guarantee. On low-volume or news-driven days, the market may stall well before it reaches the measured target.
Avoid trading every ORB signal. The weakest conditions tend to occur when the opening range is unusually wide, price is whipping through both sides of the range, or a major economic report is about to hit. Some days are built for clean directional execution. Other days are built to punish traders who cannot sit on their hands.
Position Size Makes the Setup Real
A sharp entry means nothing if your position size turns a normal stop into an emotional event. NQ is fast. One point in the E-mini NQ contract equals $20, while one point in MNQ equals $2. ES is $50 per point, and MES is $5 per point. Know what your stop costs before you press buy or sell.
Using the NQ example above, a 16-point stop on one NQ contract represents $320 of risk before commissions and slippage. If that number makes you second-guess every tick, the answer is not to tighten the stop inside random noise. Trade smaller, use micro contracts, or pass on the setup.
This is the part many educators skip because it is not exciting. But risk control is what keeps a strategy usable. You do not need a spectacular win to build consistency. You need repeatable decisions, losses that stay contained, and enough discipline to let valid trades play out.
Put the Opening Range on Your TradingView Chart
The practical advantage of an ORB is visual clarity. Your chart should show the opening-range high and low without forcing you to calculate levels while NQ is sprinting. Once the range is marked, you can focus on whether price is accepting above, rejecting below, or chopping inside it.
Quantum Navigator is built around that kind of structured execution: clear chart-based conditions, predefined risk, and less room for second-guessing. The tool does not replace discipline. It gives discipline a framework you can actually follow when the opening bell gets loud.
Do not judge this setup from one trade or one screenshot. Replay it across multiple sessions, record the range size, note the time of each break, track whether a retest occurred, and measure the outcome using the same rules. The chart will tell you the truth if you stop changing the rules every time you see a loss.
Tomorrow, mark the opening range before the first trade. Then wait for price to prove something outside it. The patience to wait for that proof is often the edge traders spend years trying to find.