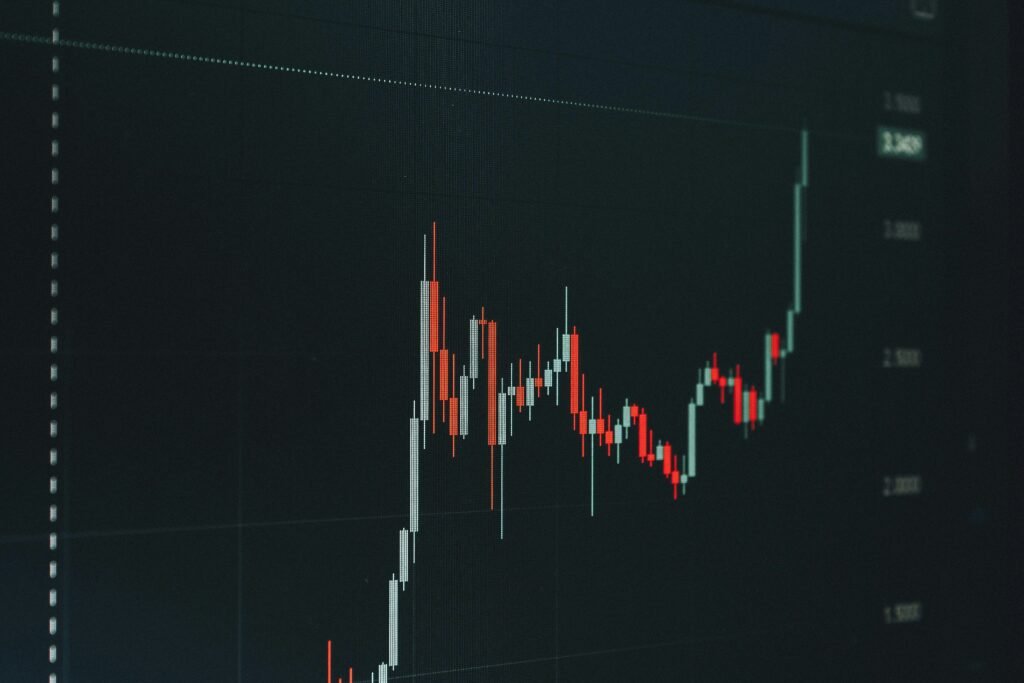
Your NQ chart should help you make a decision in seconds. If it takes five indicators, three conflicting alerts, and a debate with yourself to enter a trade, the chart is not helping. It is slowing you down.
Learning how to avoid indicator overload is one of the fastest ways to improve execution as a futures day trader. This is especially true when you trade NQ or ES, where price can move hard, reverse fast, and punish hesitation. More indicators do not create more certainty. They often create more excuses to miss the move, chase the move, or take a trade you cannot clearly explain.
Drop the nonsense and noise. Your job is not to build the most complicated TradingView layout possible. Your job is to identify a repeatable setup, define your risk before entry, and execute without turning every candle into a courtroom trial.
What Indicator Overload Looks Like
Indicator overload happens when your chart contains more information than your process can use. You may have an EMA stack, VWAP, RSI, MACD, volume profile, Bollinger Bands, pivot points, order blocks, Fibonacci levels, market structure labels, and several signal tools all fighting for attention.
None of those tools are automatically bad. The problem is that they frequently measure related information in different forms. A moving average and MACD both react to price direction. RSI and stochastic both attempt to describe momentum. Adding every version of the same idea does not confirm a trade. It can simply repeat the same lagging message in different colors.
The real warning sign is conflict. One indicator says buy because price is above the 20 EMA. Another says sell because RSI is overbought. A third says wait for a MACD cross that arrives after the move is already gone. Now you are not trading a system. You are shopping for permission.
That behavior is deadly for prop firm traders. Evaluations do not care how many tools you used. They care whether you can protect the account, avoid unnecessary drawdown, and produce disciplined results.
Why More Indicators Make Traders Worse
Most traders add indicators after a losing streak. They assume the missing piece is another confirmation filter. Sometimes a strategy does need a filter. More often, the trader has not defined the purpose of the tools already on the chart.
A crowded chart causes three expensive problems. First, it creates analysis paralysis. NQ can travel 20, 40, or 100 points while you wait for every condition to agree. By the time the signals line up, your risk-to-reward is worse and your stop needs to be wider.
Second, it encourages hindsight bias. After a loss, you can always find one indicator that “warned” you. After a winner, you can find another that “confirmed” the entry. That does not mean either signal was part of a testable process before the trade.
Third, it hides the one thing that pays you: price behavior at meaningful locations. A clean rejection from VWAP, a breakout from a well-defined range, or a pullback into a trend can be visible without covering the chart in signals. If you cannot see the candles, structure, and key levels clearly, you are not reading the market. You are reading decorations.
How to Avoid Indicator Overload: Give Every Tool One Job
The fix is not necessarily trading with zero indicators. The fix is making every tool earn its place. Each item on your chart needs a specific job that is different from the others.
Start with price. Price action tells you what the market is actually doing: trending, ranging, breaking out, rejecting a level, or stalling. Then add a tool for context, such as VWAP or a higher-timeframe level. Finally, if needed, add one tool that helps you time an entry or manage the trade.
That can be enough. For example, an NQ trader might use market structure to establish direction, VWAP to identify a decision zone, and a rules-based entry signal to time the pullback. The stop goes beyond invalidation, not at a random number of points. The target is based on the next logical area of liquidity or a predefined reward multiple.
Notice what is missing: five momentum oscillators trying to vote on whether the trade feels safe.
A tool should answer one of these questions: What is the market context? Where is my setup location? What triggers my entry? Where is the trade invalidated? Where do I take profit? If an indicator does not clearly answer one question, remove it.
Build a Chart That Supports Fast Execution
For scalpers, simplicity is a speed advantage. Your chart should let you see the setup, define the risk, and act without searching through clutter.
Begin by stripping your TradingView chart down to bare candles and your essential levels. Keep the session high and low, overnight range if it matters to your plan, major support and resistance, and one or two context tools. Then trade that layout in replay or simulation for a meaningful sample of sessions.
Do not add something back because one trade would have looked better with it. Add it only if it improves a specific rule across enough examples. Ask: Does this tool eliminate low-quality entries? Does it improve target selection? Does it reduce drawdown? Can I follow it in real time without hesitation?
If the answer is vague, it belongs in the trash.
Color matters too. A chart packed with bright lines and labels can make normal price movement feel urgent. Use a restrained color scheme. Make your entry, stop, and target levels obvious. Everything else should stay visually quiet. The market already provides enough stimulation without your chart screaming at you.
Stop Looking for Confirmation and Start Defining Conditions
The need for confirmation is usually the need to avoid being wrong. That is understandable, but it leads traders into a trap. No indicator stack can guarantee that an NQ breakout will hold or that ES will not reverse at a key level.
Professional execution is not about achieving certainty. It is about defining conditions and controlling the cost when those conditions fail.
Write your setup in plain language. For example: trade only in the direction of the intraday bias; wait for price to pull back to a defined area; require a clear rejection or signal; place the stop past the level that proves the idea wrong; take partials or exit at the next planned objective. That is a workflow. You can test it, review it, and repeat it.
Compare that with: “I will buy when the moving averages are aligned, RSI is not too high, MACD is green, volume is increasing, and the candle looks strong.” That is not a rule set. It is a moving target. On a fast chart, it will change every few seconds.
Rules remove decision friction. They do not remove losses. A clean system will still have losing trades, and anyone promising otherwise is selling magic. But a rules-based process makes losses smaller, reviews more honest, and improvements far easier to identify.
Use One Source of Truth for Your Entry
This is where many traders finally stop bouncing from indicators. Choose the primary trigger that puts you into a trade. It may be a specific candle pattern at a key level, a break-and-retest, or a visual signal designed around your strategy. Whatever you choose, it needs to be objective enough to recognize quickly.
Do not let a secondary tool overrule the primary trigger whenever you feel nervous. If the trade meets your written conditions, take it with the planned size and risk. If it does not meet the conditions, leave it alone. You do not need to manufacture a trade because the market is moving.
Quantum Navigator is built around this kind of structured decision-making: clear chart-based setups, predefined risk points, and less room for emotional improvisation. The goal is not to make trading look complicated. It is to make the next action clear.
Audit Your Indicators Every Week
Your chart should not become permanent just because you spent time building it. Once a week, review every indicator and drawing tool you use. Look at your trade journal alongside the chart.
Did a tool help you avoid a bad trade according to your actual rules? Did it make an entry clearer? Did it change risk management in a way that improved results? Or did it just make you feel more prepared while adding hesitation?
Be ruthless. If two tools provide the same message, keep the one you understand and execute best. If an indicator requires constant interpretation, it may not fit a scalping approach. If your edge depends on speed, a complicated dashboard can become a liability.
There is one exception: some traders need a little extra context when trading a different session, a new market condition, or a slower timeframe. That is fine. The standard is not minimalism for its own sake. The standard is usefulness. Add complexity only when it creates a measurable improvement in decision quality.
The cleanest chart is not the one with the fewest lines. It is the one that lets you see your setup, respect your stop, and act without second-guessing yourself. Remove one unnecessary indicator before your next session, then give your rules room to work.